How Retail Heatmaps Work: A Practical Guide to In-Store Heat Mapping Technology
Most articles about “people counting solutions” stop at a single number: how many people walked through the door. A heatmap goes further – it turns raw positional data into a picture of shopper behavior, zone by zone. This guide focuses on that layer: how in-store heatmaps are generated, how to read one, and how it differs from (and builds on) plain footfall counting.
What a Retail Heatmap Actually Shows
A heatmap overlays your store’s floor plan with color gradients – typically deep red or orange for high-traffic, high-dwell areas and blue or green for areas shoppers rarely reach. Unlike a single daily footfall total, a heatmap answers layout-level questions: Which fixture actually stops people? Does the new endcap get ignored? Is the queue backing into the aisle behind it?
The Sensor Technology Behind the Heatmap
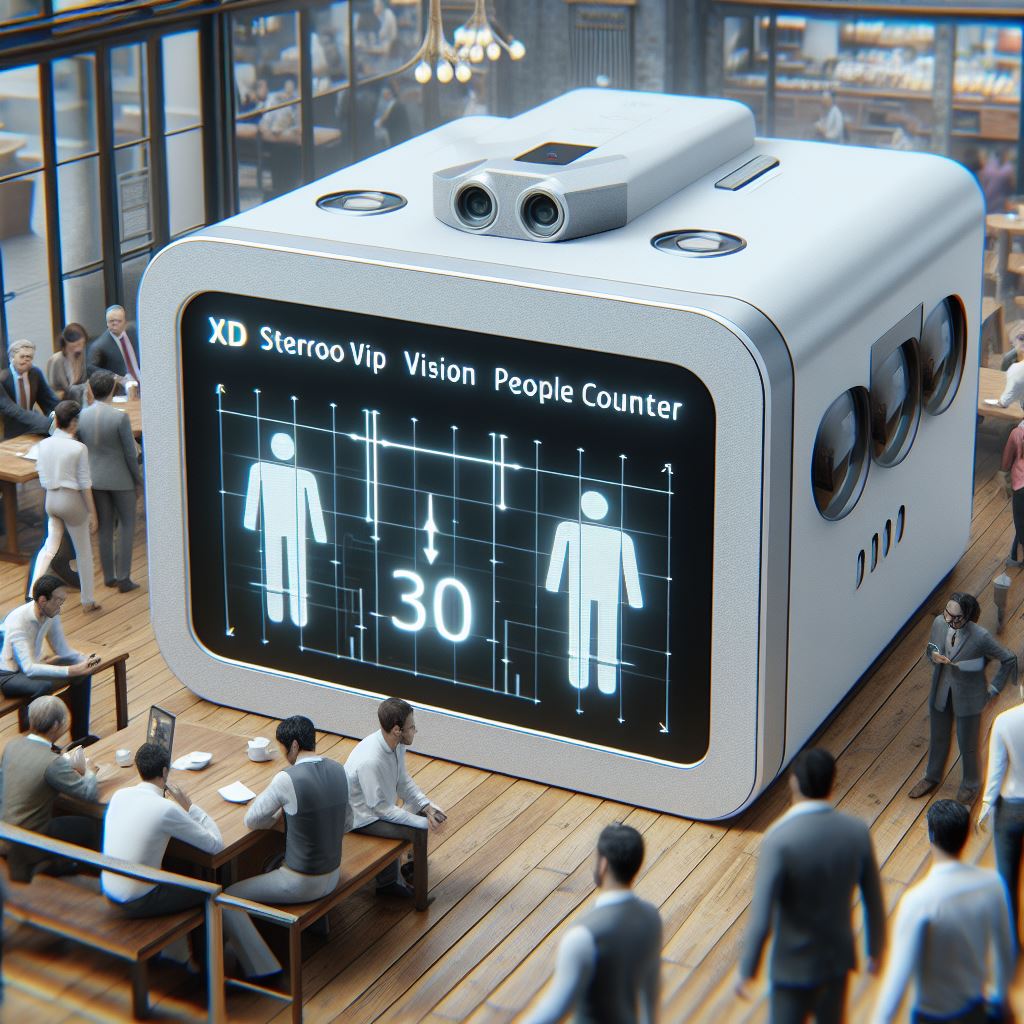
Heatmaps aren’t produced by a separate category of hardware – they’re a software layer built on top of the same sensor families used for people counting:
- 3D stereo vision sensors – track head/shoulder positions in three dimensions, giving precise zone-level coordinates.
- AI video analytics – reuse existing CCTV feeds to infer paths and dwell time without new hardware.
- Thermal and ToF (time-of-flight) sensors – work in low light and preserve privacy since no identifiable image is captured.
- Wi-Fi / BLE proximity sensing – approximates zone dwell using device signal strength, useful for large-format stores.
For a full technical breakdown of each sensor family and how they’re specified, PeopleCountings’ people counting systems guide is the more complete technical reference – this article assumes that groundwork and focuses on what you do with the data once it becomes a heatmap.
Reading Hot Zones vs. Cold Zones
A hot zone isn’t automatically a “good” zone. Context matters:
- Hot zone at checkout – expected, but if it’s unusually hot, it may indicate a queue problem rather than sales strength.
- Hot zone at an endcap – a genuine win; correlate with POS data to confirm it converts, not just attracts.
- Cold zone in a “power aisle” – a layout red flag worth testing with a fixture or signage change.
- Cold zone near the entrance – often a sign shoppers are being pulled too quickly toward one side of the store.
Heatmaps vs. Plain People Counting: What’s the Real Difference
They’re complementary, not competing:
- People counting answers “how many” – total visits, conversion rate, staffing ratios.
- Heatmapping answers “where” and “how long” – layout performance, zone dwell time, path density.
If your only requirement is an accurate footfall count – without zone-level visualization – a lighter-weight people-counting platform may be all you need. PeopleCountings’ 2026 Power List ranks pure counting platforms by accuracy, POS integration and pricing model so you’re not paying for zone analytics you won’t use.
Frequently Asked Questions
Do I need new hardware to get heatmaps if I already count footfall?
Often no. Many 3D and AI-video counters already capture the positional data a heatmap needs – it’s a licensing/software question as much as a hardware one. Check with your current vendor before buying new sensors.
How accurate are camera-based heatmaps in low light?
Thermal and ToF sensors hold up better than standard AI-video in low light or high-glare storefronts, since they don’t depend on visible-light contrast.
Are retail heatmaps GDPR-compliant?
Yes, when built on anonymized, aggregated position data rather than identifiable video or device IDs. PeopleCountings’ GDPR & AI privacy guide covers what “anonymized” needs to mean in practice.
Continue Your Research: Related Guides
- Unlocking Retail Success: The Power of Heatmaps – the business case for heatmapping.
- Reading a Retail Heatmap: Hot Zones, Cold Zones & Visual KPIs – how to interpret the colors.
- 20 Retail Heatmap KPIs & Zone Metrics – the metrics behind the visualization.
- People Counting by Industry (PeopleCountings) – sector-specific use cases beyond retail.
External resources: Shopify Retail Analytics Guide and the National Retail Federation (NRF) provide industry benchmarks on retail foot traffic.